The UDB field guide
Get into your data,
one task at a time.
The guides run from your first inspection to a dashboard built around your game. Pick a task and follow the steps.
Check which version a guide covers. Core guides follow the 1.0.0276 manual. Guides marked Development describe version 2.13.08106, and some of their features may not be in the current Asset Store package. Controls may look different in your version.
26 guides
No guide matches.
Clear the search or try a feature name.
Import the package and open your first object.
Import the UDB package from the Unity Asset Store (opens in a new tab) , then start with a scene object whose data you know.
- Open UDB from Unity’s Tools menu.
- In Instance mode, drag a GameObject, Component or ScriptableObject into Root Obj.
- Find a field you recognize and choose Inspect ► to open its nested data.
- Use the breadcrumb and the back/forward buttons to return.
For class-level data, switch to Static mode and enter a type name such as Time, Physics or one of your own classes. Static mode needs no object instance.
Open private members and nested collections, one level at a time.
- Select a root object and the component you want to inspect.
- Use the member visibility controls to show private fields, properties or static members.
- Choose Inspect ► on an object, list, array or dictionary. In a large collection, use the pages and the name/type filters to narrow the view.
- Lock the padlock to keep the window on this target while you select other objects.
A field shows stored data. A property runs its getter to show a value, so property reading has its own switch, Live Property Read (see Reading controls & performance). Turn it on when you need it. A hidden value, a blocked getter and a null reference are three different cases.
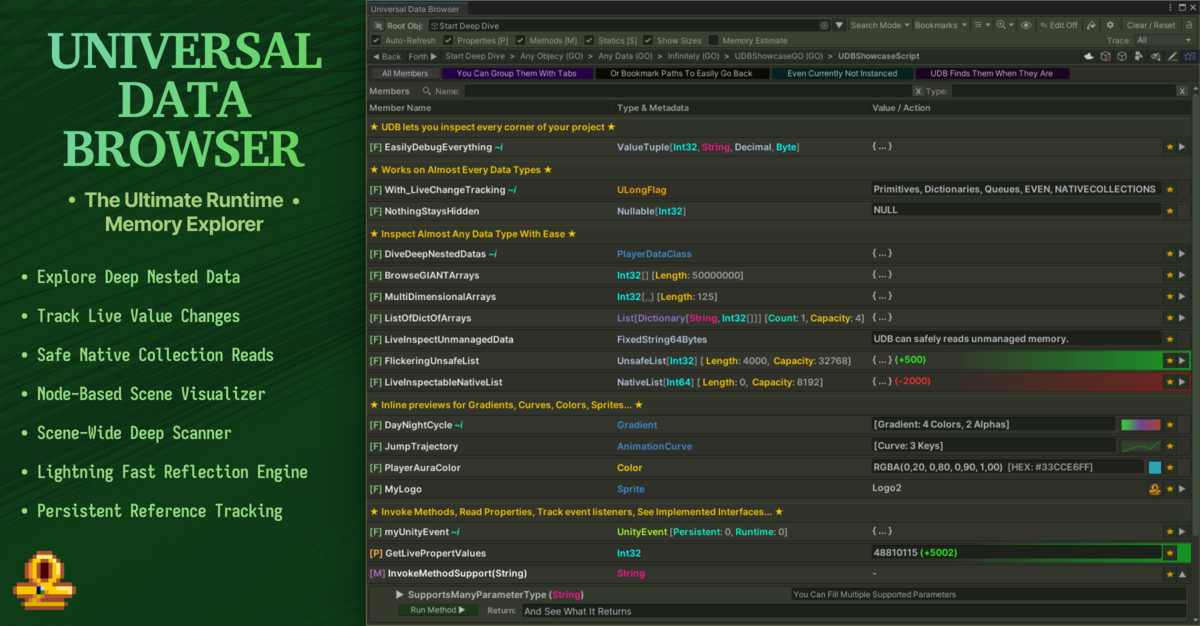
Change a value and watch what your game does with it.
- Enter Play Mode and find a supported value, such as a number or boolean, on a test object you can afford to break.
- Turn on UDB’s editing switch. If a field stays locked, check the matching safety switch: private/static, asset or Edit Mode.
- Change the value and watch the result in your game. Your game code may overwrite it on the next update.
- Turn editing off when you are done.
Reading a private member does not make it editable; editing has its own switches. Some properties and collection types have extra restrictions.
Save a view, or keep one value on screen.
A bookmark takes you back to a view. A pin keeps one value visible while you browse elsewhere.
- Go to a nested path and use the folder/bookmark control in the toolbar.
- Open the saved view from your bookmarks. The target and path must still resolve.
- To keep watching a value, click the row’s ★ to add it to the Pinned Watchlist.
- Remove pins you no longer need, and clear a view when you are done with its objects.
When a pinned path stops resolving, the pin circuit breaker stops searching for it until the next Play/Pause state change. Open views and pins hold references to their targets, which can keep those objects from being garbage collected.
Back to guide searchSet what UDB reads and how often it refreshes.
UDB starts with its safety switches on. Turn on only the reads and edits your inspection needs.
- Live Property Read: reads properties by running their getters. Some Unity getters stay blocked because reading them can create objects, among them
Renderer.materialandMeshFilter.mesh. - Unsafe Custom Collection Reading: reads custom collections, whose counts and iterators can run your own code. Built-in collections are inspected without this switch.
- Allow Live Unsafe Read: turns on live native reads. You opt in each session, because the switch resets. It does not make a read safe while a job is writing to the collection.
- Repaint Delay (s): a higher delay means less refresh work. Zero repaints without a cap.
- Trace History Log Delay: raise it to take history samples less often when you track data that changes quickly.
Memory figures are estimates, and they change with the selected view (shallow, layout or deep). Clear unused views and pins when they hold on to objects or add inspection work.
Back to guide searchRecord a pinned value and read it as a graph or a log.
- Pin the value you want to follow.
- Use its recording control and open Record History.
- Switch between the graph, the text log and any analytics available for the value’s type.
- Choose Export History to save a text record you can compare or share.
Set the history delay to fit what you are watching: a slow sample rate for a long observation, a faster one for short changes. A watchdog pauses the Editor when a sampled value meets its condition.
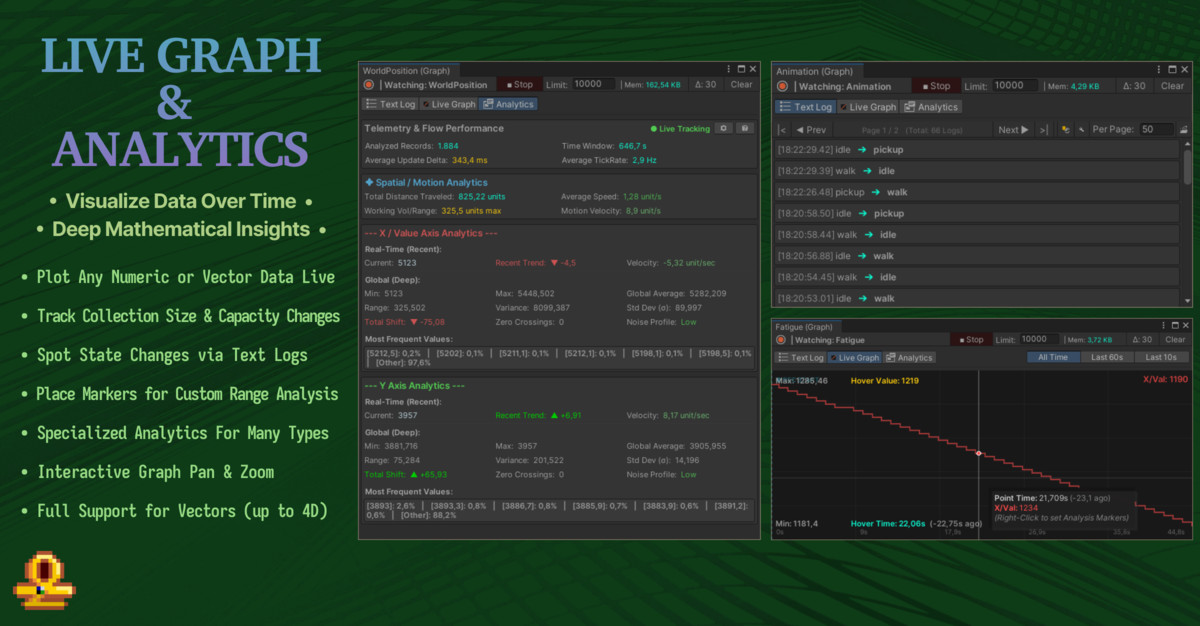
Search your data for references, names, nulls and changing values.
- Open Deep Memory Scanner and choose the target and search scope.
- Choose the kind of search: object references, component/field names or types, missing/null references, or destroyed Unity references.
- Run the scan. Inspect a result to follow its path back into UDB.
- For a changing value, use First Scan, change the game state, then use Next Scan to narrow the list by changes, increases or decreases.
To see which inspected objects still refer to a selected object, search for references to it. Start with a narrow target and depth, and widen the search after that.
A scan covers the traversal you configured and the data types UDB supports. References outside that scope do not appear in the results.
Back to guide searchSee which members of a large object change during an action.
- Open Live Deep Observer for the object you want to monitor.
- Choose a sampling interval and the nested data you want to observe.
- Perform the gameplay action you are investigating.
- Review the changed paths, grouped results and hit counts, and inspect any path that stands out in UDB.
For one value you already know, a pinned history is enough. The observer is for finding out which members change during an action, such as equipping an item.
The observer compares samples, so a value that changes and changes back between two samples may not show up. If a large object graph produces too much noise or refresh work, narrow the observation.
Back to guide searchChain data selections and save them for reuse.
Search & Bind builds a data flow out of visual steps. It is a separate feature from UQL and from the collection search box.
- Open Search & Bind Pipeline and select a Source.
- Use Iterate to visit a collection and Extract to select a member.
- Add a Filter to keep only the items you need. Add Math/Call steps when the flow needs them.
- Use Collect to gather the results, then save the profile for reuse.
Savevar and Loadvar pass values between pipeline steps. In views that support binding, matching saved profiles appear under the green binding control.
Start with a small pipeline: source → collection → field → filter. Check that each step outputs the type and values the next step expects.
Back to guide searchDraw positions and vectors in the Scene view.
- Open Visualizer for the selected objects.
- Choose the data source and extract the positions, vectors or other supported values you need.
- Pick a drawing type and set its options.
- Narrow the drawing with filters and pipeline steps, and save a preset if you want to use it again.
Use it for a collection of positions, or for a vector that is hard to read as numbers in a row. Check whether your source uses local or world coordinates before you read the drawing.
The Visualizer draws supported data that comes out of its pipeline. If a drawing is empty or in the wrong place, look for a missing source, a filtered-out item or a mismatch between local and world coordinates.
Back to guide searchGo from a member in UDB to source code that may touch it.
Code Detective searches your source code statically. Use it when you have found a member in UDB and want to look at the code that may be related to it.
- Open the analyzer for the member or search target.
- Review the candidate source matches.
- Open a match in your IDE and read the code around it.
Find a type, member, value or missing entry.
- Open a collection and find Search Value:. Dictionaries and native maps have separate Key: and Value: fields.
- Enter a search expression, then press Enter or choose Find.
- Inspect the matching items. Use X to clear the search.
| Example | What it does |
|---|---|
TYPE: enemy | Matches an item’s runtime type name. |
HAS: health | Finds a component on a GameObject/Component, or a field/property on an ordinary object. |
VALUE: idle | Searches the item’s own text and its simple declared fields/properties. |
EXTRACT: health | Extracts the named member from matching items. |
META: text | Searches appended metadata. |
NULLS | Finds null entries. |
This syntax belongs to UDB’s collection search and is separate from UQL. Searches can stop at a time or count limit, so read any incomplete-search warning. VALUE: stays within the item and its simple members and does not search deeper levels.
The development reader also handles more queue, multidimensional-array and native collection cases. Native support depends on the type and the API it exposes; some unsafe collection types are still unsupported.
Back to guide searchMark a time range in the graph, then read or export only that range.
- Record a value and open Record History → Live Graph.
- Right-click once to set Marker A, then again to set Marker B.
- Switch to Text Log to see the entries in that interval.
- Choose Export History to export the selected interval.
A third right-click starts a new Marker A. Clear Markers removes the interval filter. You place markers in the graph, and the Text Log filters by their timestamps.
After a Unity domain reload, you may need to reopen the graph. A marked range filters the recording you have; samples that were never captured stay missing.
Back to guide searchRead a buffer back as typed data or as an image.
- On a supported buffer row, choose !Read ► (Read GPU Buffer) to open GPU Buffer Reader.
- Choose Struct Array, then enter a fully qualified C# Type: or use a quick type button.
- Choose Push New Read. Use Update View to refresh an existing result.
- For an image, choose Texture2D, enter Width, Height and Format, then choose Push New Image.
Auto-Refresh / Every … s reads the buffer back at a fixed interval. Pick an interval that fits the buffer’s size and the cost of reading it.
Set up a dashboard, a bind rule and a widget.
- Open Dashboard Manager, choose + New Dashboard and name it.
- Set Match to
ByName,ByTypeorBoth. Fill in the matching Name/Type fields; separate several matches with commas. - Choose + Add Bind Rule and name the rule.
- Choose Bind Data Variable, then use Bind To Dashboard Rule on the data row you want.
- Add a widget and enter the exact rule name in Data Source (Rule Name).
- Choose Save Dashboards.
Turn off Show in Pin List if a rule should feed widgets without adding dashboard pins. If a widget stays empty, check its rule name, the match settings and whether the target exists right now.
Back to guide searchThe widget types and how to set them up.
The widget types are MiniProgressBarGrid, ValueTextGrid, DetailedHorizontalBar, CombinedStatsCard, HeatmapMatrix, StateLEDGrid, LineGraphPlot, VerticalBarChart and IconPreviewGrid.
- Add a widget and choose its Type.
- Set its Data Source (Rule Name). Set Min Bound and Max Bound if the widget uses them.
- For a grid that supports it, set up Fixed Grid (2D Map). Set Rows (Y) to zero to get rows automatically.
- For a stats card, choose + Add Stat and assign each stat’s rule.
For a line or bar chart with exactly one source value, turn on Track History (Single Value) and set Max Points and Interval(s). This history is sampled when the window repaints, so it does not hold a point for every game frame.
A source value the widget cannot convert to a number can show as zero, so check source types before you read a numeric widget.
Back to guide searchBind to the current root or collection item.
- Turn on Relative Root when a rule should resolve against the current root object.
- Use Contextual Bind for a shared member such as
Health, and check the selected member name. - For collection steps, select
Fixed,ContextRelative,IterateLimitorIterateRange. - Set Start / Limit or Start / End, whichever the mode uses. Bounds that support it can take bound values or dashboard variables.
ContextRelative depth 0 is the deepest (current) collection index; depth 1 is its parent. The context path in the toolbar shows those depths.
IterateRange includes its end index and clamps the bounds to the collection. Contextual binding searches the members left after filtering, so a missing member returns no result.
Put sliders, number fields and buttons on a dashboard.
- Choose + Add Control, then set the label and Type.
- For
ControlVariable, set Custom Name and Def, then chooseNumberField,SliderorButtonGroup. - Set the slider’s Min/Max, or use + Btn for Add, Subtract or Set actions.
- Use the variable through the Var control of a widget or range.
These controls set a local dashboard variable and leave game fields alone. For OpenVisualizerPreset, enter the exact saved Preset Name.
The advanced ExecuteMethodButton preview calls the method on the first result of the target rule, with no parameters or one converted argument. For everyday method calls, use the method invocation workflow.
Color rows by value and show related values beside them.
Numeric styles
- Open Custom Data Stylizer → + New Rule.
- Set Var Name, a style and Min/Max.
- Choose
ProgressBar,TextColor,RowHighlight,RowBarBackorRowBarWithDiff. - If you need to, bind the bounds with Global, Indexed, Contextual or combined binding. Extract Collection Size can use a supported collection’s count. Choose Save Styles.
Related values beside a row
- Open Custom Data Display → + New Rule, then set Match and, optionally, Exact.
- Choose + Add Extract, set a Label, then Bind Metadata Variable.
- Select Global, Indexed, Relative or Contextual binding. Optional extras are Hide If Null, Draw Visual Preview and {} for a collection’s length/count.
- Choose Save Styles.
Relative metadata needs a current row path, and a path that does not resolve may show no value. In the rule manager, Showing: Context filters the list of rules. A rule’s Match Context is a separate restriction on where that rule applies.
Back to guide searchChange how numbers, colors and objects are displayed.
Open More Options → Custom Value Formats. The options include Show Color HEX, IntPtr Hexadecimal Format and Display Detailed Values For Supported Types.
Dot Format Primitive Values uses dots for thousands and commas for decimals. With three decimal places, a value can display as 1.234,500. The formatter always shows the fixed number of decimal places, even though the menu says “Max … Decimal Place”.
Alternative Object Value Format and Alternative Component Values switch supported objects to other built-in summaries. These settings change how values look; they do not let you write your own format templates.
Back to guide searchCall a method, then inspect its results and arguments.
- Turn on Methods [M] and open an invokable method. By default, a method is invokable when it has the
[InvokeableFunc]attribute. - Enter the supported parameters. For collections, use Init Collection, + Add Element or Set Null.
- If UDB asks you to acknowledge that the call can modify data, review it, then choose Run Method ►.
- Use Inspect … Args to open collection arguments the call returned or changed.
ref arguments need a value before the call; the call fills in out arguments. The preview shows the first 49 items of a collection, and the items after them are still kept.
Force All Methods Invokeable is a separate override. [PropertyFunc] treats a parameterless method as a live read, so it can run repeatedly. Method calls can change game or Editor state.
Show memory and render counters, and log your Editor sessions.
- Turn on Show-Hide Toggles / Show Memory&Render Metrics, or use MS / Show Metrics.
- Choose Configure Profiler Metrics to select counters and the update interval.
- For session history, turn on Messages / Enable Session Time Logger, then choose Open Session Logs.
The numbers include the Editor, UDB and other open windows, so they differ from a player build. Reset Session Total GC Counter resets the accumulated counter.
Strict Session Tracking (Crash-Safe) keeps a more persistent session record. The logs show uptime and crash counts, and you can reload or clear them. A session marked CRASHED has no normal close on record; UDB does not diagnose the cause.
Back to guide searchSee what UDB recorded for each edit.
- Turn on Edit Mode in UDB and choose the history icon labeled Edit Logs.
- Review the timestamp, the Edit Mode/Play Mode context, the status and the Old / New values.
- Use Copy for a value, or Inspect to open a saved path.
Reload reads the archive again. Clear All Logs deletes the records and leaves project values as they are. Logs are stored in UserSettings/UDB_EditHistory.log, and up to 1,000 records are loaded.
Which package each guide applies to.
The UDB package on the Asset Store is the visual tool. UQL is in development and is meant for the full UDB + UQL package.
See the UQL page and workflow examples
UQL queries your project’s data and saves workflows you can run again. The UQL guides, commands and examples are the current development reference. The collection search expressions in this guide are part of UDB and separate from UQL.
UDB Lite is the core edition of UDB for your own project. On your own project it opens private and nested data, edits supported values and keeps bookmarks; the full edition’s graphs, watchlists, scanning, visualization and dashboards appear as sample previews. It is coming to the Asset Store. The Lite page shows what’s in it and will link to the download once it’s out.
Features marked Development may not be in your installed package. Check your version against the current Asset Store release notes.
Back to guide searchCommon problems, and what to put in a report.
A field or property is missing
Check the root object, member visibility, the name/type filters and the property reading switch. Clear any collection filter before you decide an item is missing.
A pin or dashboard is empty
The target may have been destroyed or replaced; open its path again. For a dashboard, check the match rules, the exact source rule name, the current context and the member filters.
A change does not stick
Your game logic may write the value again. Check which mode Unity is in, and whether the target is an asset or a runtime instance: both affect whether an edit stays.
The Editor slows down while inspecting
Raise the repaint and history delays, narrow deep scans and observers, stop recordings you do not need and clear unused pins. Property getters and GPU readback can add work on top of drawing the window.
Email me at deadbeakofficial@gmail.com with your Unity version, your UDB version, the tool or window involved, what you expected and what happened, and the shortest steps that reproduce it.
Back to guide search